.svg)
Understanding QSR Resilience: A Look at Taco Bell Through Location Insights


When a restaurant brand makes headlines, how quickly does that attention show up in visits? And how far does the effect reach?
In July 2026, Taco Bell faced those questions amid a Cyclospora outbreak linked by federal investigators to recalled iceberg lettuce served at some of its restaurants. For QSR marketing and operations teams, the situation illustrates the importance of understanding when traffic changes, which markets are affected, and where foot traffic recovery begins.
For this analysis, Azira used its Estimated Visits Core dataset to analyze daily estimated visits to 2,968 Taco Bell locations across 15 U.S. states, from May 1 through July 31, 2026. Here’s what the analysis revealed:
Question 1: When did visits start to change?
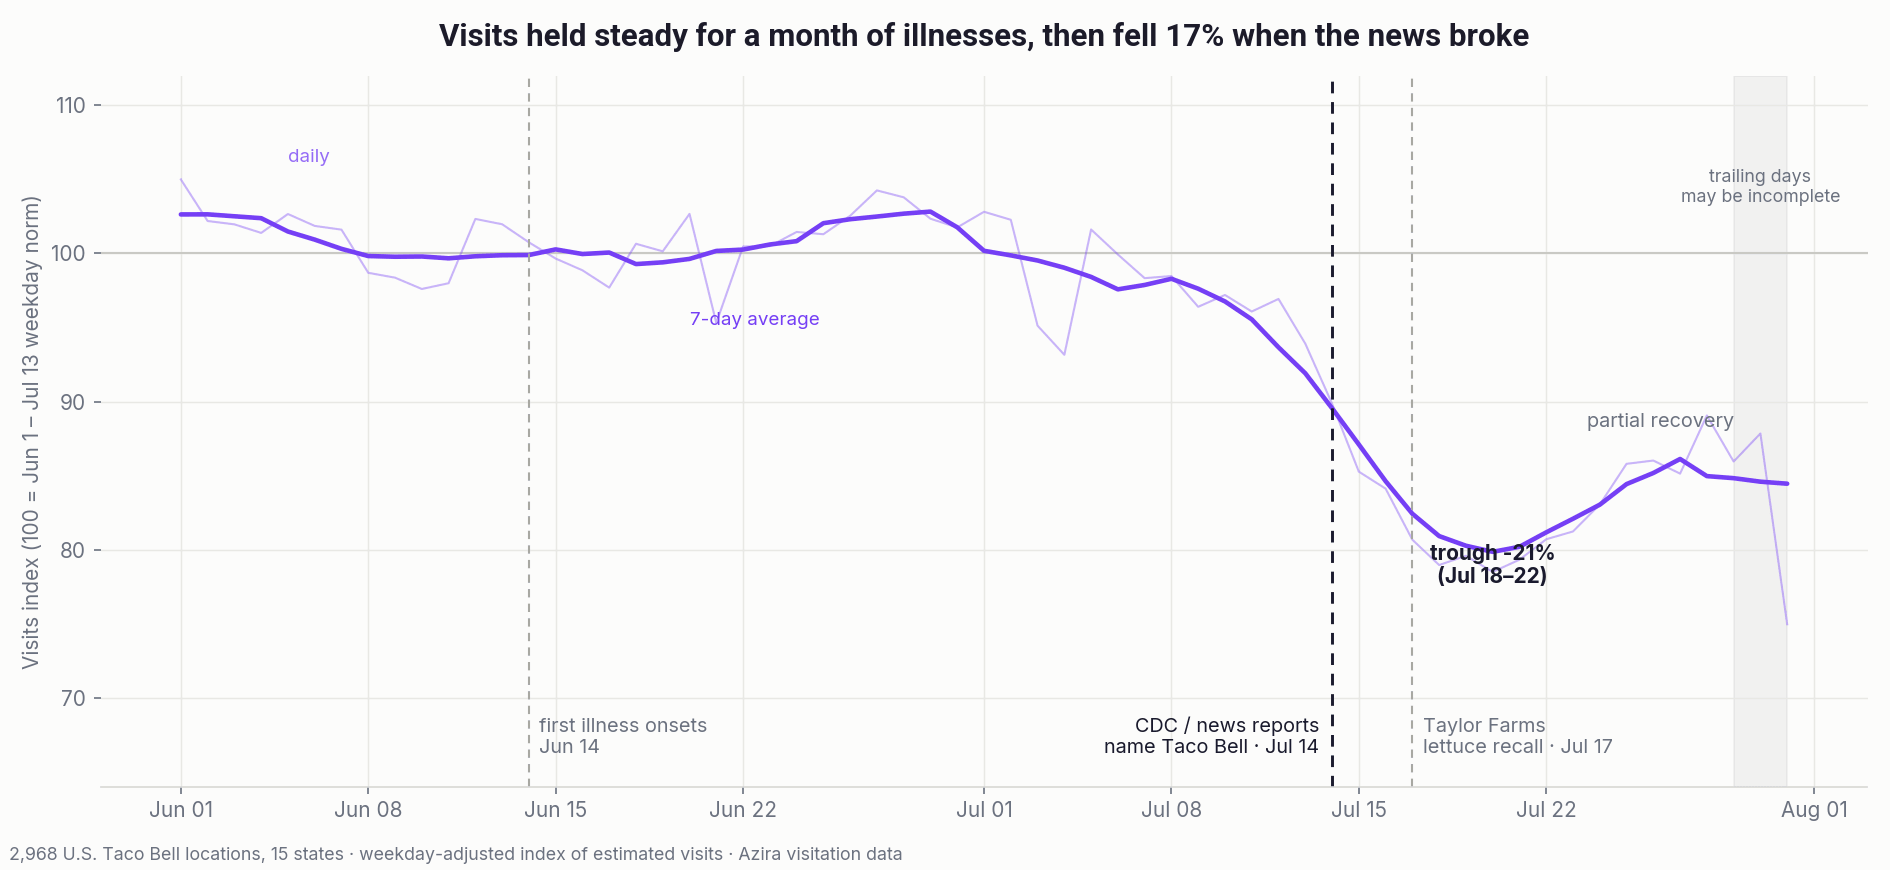
Across the locations studied, estimated visits were 17% below baseline from July 14–31. The sharpest decline came during July 18–22, when visits were approximately 21% below baseline. Comparisons used the June 1–July 13 period and matched weekdays to account for normal weekly traffic patterns.
The timing aligns with the July 14 news coverage naming Taco Bell. While multiple factors can influence visitation, the daily view reveals when consumer behavior began to shift and the magnitude of the change. QSR teams can then connect those patterns with news, promotions, and other market events to build a more complete picture of what may be influencing demand.
Question 2: How far did the decline reach?
The pullback extended beyond the five states initially linked to the outbreak. Among the locations analyzed, Michigan recorded a 20.2% decline, while Florida and New York also saw substantial decreases.
Question 3: What locations were driving the decline?
The decline was widespread: 96% of the 2,814 locations with complete pre- and post-period coverage lost traffic, with a median decrease of 16%. Yet the size of the change varied considerably. Individual locations in Mount Morris, Michigan, and The Villages, Florida, recorded declines of 63% and 52%, respectively.
Question 4: When did visits start to recover?
The report showed an early improvement after the July 18–22 low. By July 26–30, the visitation index had risen from 79 to 87, against a baseline of 100. In other words, visits moved from roughly 21% below baseline to 13% below it.
What QSR organizations can take away
Taken together, these findings show how daily, market-level, and location-level insights can help QSR operators and marketers understand when a foot traffic shift began, how far it extended, where its impact was greatest, and when recovery emerged. QSRs can evaluate these patterns alongside news, promotions, operational events, and other market contexts to build a better understanding of impact following major events that influence visitation patterns and inform decisions across competitive analysis, site selection, planning, campaign activation, and measurement..
This analysis was powered by Azira’s Estimated Visits Core, which provides modeled daily visit estimates using mobility and transaction data. EV Core helps teams analyze disruptions, compare performance across locations and markets, and monitor changes over time within their existing analytics workflows.
Learn more about Estimated Visits Core and how it can support your location analysis or contact us today.
About the analysis
Source: Azira’s September 2026 report, Anatomy of a Brand Shock: Taco Bell and the 2026 Cyclospora Outbreak. Findings reflect modeled visits in the 15-state sample, not all U.S. Taco Bell restaurants. May was excluded from the comparison baseline because of a panel update. Coverage decreased during the final two to three days, so late-July estimates may understate visits. The study ends July 31 and does not establish causation or measure later recovery. EV Core provides daily estimates refreshed monthly.



.svg)
.svg)

